
The benefits of certain portfolio hedges came into clear focus during the 2008-2009 financial crisis and did so again during the subsequent European sovereign debt crisis, the 2018 December stock market pullback and the most recent COVID-19 pandemic.
Many tail hedges work well during crises if timed appropriately, but are technically complex investments, and can be expensive to hold systematically.
Historically, gold prices have not increased as rapidly in tail events1 as hedges that track market volatility indices.2 But, importantly, gold has served as a safe haven, improving risk-adjusted returns and adding welcome liquidity during times of crisis, without the costly effects of systematic implementation or the difficulties of market timing.3
Comparing hedges across metrics
We have established the Relevance of gold as a strategic asset and the importance of portfolio diversification, but in this analysis we look specifically at gold’s role as a hedge compared to other well-established hedges.4
We focus on volatility and credit hedges as well as real assets, particularly precious metals, and adjust the amount of a given hedge in a portfolio depending on the risk exposure of that portfolio.5 Finally, we ranked the effectiveness of each hedging strategy based on attributes including returns, portfolio volatility, risk-adjusted returns and portfolio drawdown.
Our analysis shows that, historically, any of the hedging choices are better than a diversified hypothetical portfolio without hedging (Table 1). And while each of the choices have merit in various market conditions, our analysis shows that historically, gold is generally the overall optimal hedge over the long run when considering these attributes.
Table 1: Performance of hedging strategies in an average pension fund portfolio over the past 20 years*
Ranked (1= most optimal to 9 = least optimal) for each category and overall.
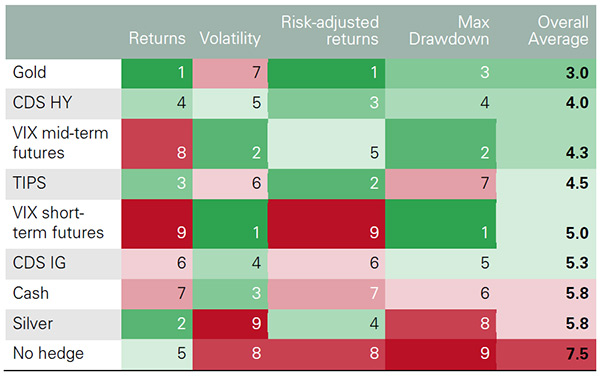
*Performance between March 2000 and March 2020. The hypothetical portfolio is based on Willis Towers Watson Global Pension Assets Study 2019 and Global Alternatives Survey 2017 as described in the Appendix in the full report.5 Performance is based on blended weights of the hedges ranging from 2.5% to 10% of the portfolio, proportionately reducing the rest of the portfolio by the initial weights. ‘Returns’: average of cumulative and average returns; ‘Volatility’: overall portfolio volatility; ‘Risk-adjusted returns’: average of the return on risk, Sharpe ratio and information ratio; ‘Max drawdown’: the most the portfolio lost during any trough. See the Appendix in the full report and footnote4 for definitions of ‘VIX short-term futures’ ‘CDS IG’, ‘CDS HY’; and ‘TIPS’.
Source: Bloomberg, World Gold Council
Tomado de Gold.org
